| Index: Source/devtools/front_end/profiler/d3js_trace/README.md
|
| diff --git a/Source/devtools/front_end/profiler/d3js_trace/README.md b/Source/devtools/front_end/profiler/d3js_trace/README.md
|
| new file mode 100644
|
| index 0000000000000000000000000000000000000000..e93c6007920f95d7c44aa33b0ea37ded9f96fffe
|
| --- /dev/null
|
| +++ b/Source/devtools/front_end/profiler/d3js_trace/README.md
|
| @@ -0,0 +1,75 @@
|
| +d3js_trace
|
| +==========
|
| +
|
| +Trace data visualization with D3js
|
| +
|
| +ORVERVIEW
|
| +---------
|
| +Finding CPU bottle neck is a usual tasks of performance analysis. One of the
|
| +efficient way of finding the hot-path is to sampling stack trace of the system.
|
| +However, it is difficult to read collected stack trace text data just as it
|
| +is, because usually text trace data consists of enourmous amount of data.
|
| +
|
| +To solve the problem, making trace data human readable with visualization is a
|
| +good solution. D3js_trace visualize the sampled stack trace data with D3js. D3js
|
| +is a JavaScript library for manipulating documents based on data. By
|
| +visualizing trace data with HTML, SVG and CSS, we can easily detect where the
|
| +CPU bottle neck is.
|
| +
|
| +EXAMPLE
|
| +-------
|
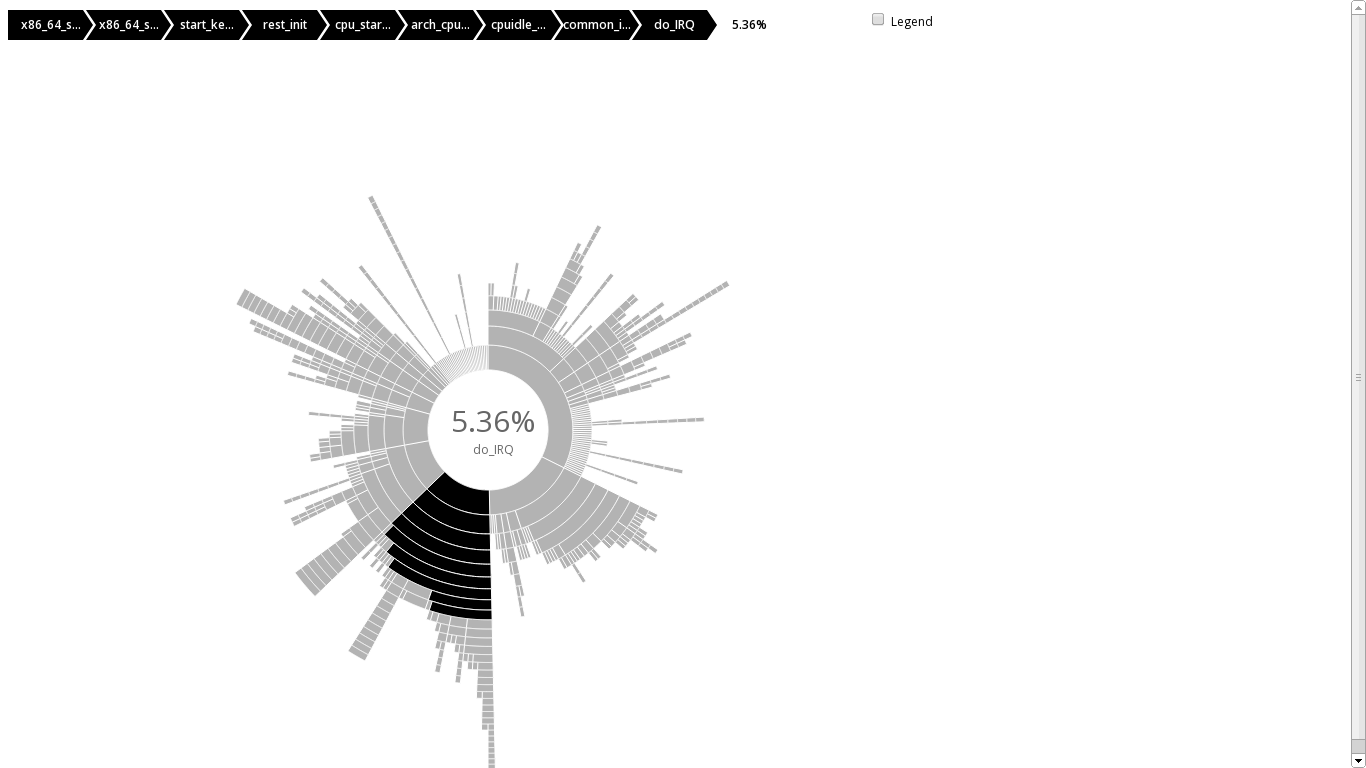
| +The following image is the visualized stack traces sampled with 'perf'. perf is
|
| +a performance counters subsystem in Linux. They form a basis for profiling
|
| +applications to trace dynamic control flow and identify hot-spots.
|
| +
|
| +
|
| +
|
| +Here 'sunburst' form is used. A sunburst is similar to the treemap, except it
|
| +uses a radial layout. The root node of the tree is at the center, with leaves
|
| +on the circumference. The area (or angle, depending on implementation) of each
|
| +arc corresponds to its occurrence count.
|
| +
|
| +Interactive WEB page example is also available at [HERE](http://etsukata.com/d3js_trace/sample1/).
|
| +
|
| +USAGE
|
| +-----
|
| +
|
| +Clone the repository:
|
| +
|
| + # git clone https://github.com/Etsukata/d3js_trace.git
|
| + # cd d3js_trace
|
| +
|
| +First, we need to sampling stack traces. d3js_trace uses Linux 'perf' command to
|
| +sample stack traces.
|
| +This can be done with the following command:
|
| +
|
| + # perf record -g fp -a sleep 3
|
| +
|
| +Translate sampled trace to json for visualizing it with D3js:
|
| +
|
| + # perf script | ./d3trace.py > trace_json.js
|
| +
|
| +View HTML file with WEB browser:
|
| +
|
| + # firefox index.html
|
| +
|
| +THANKS TO
|
| +---------
|
| +
|
| +d3js_trace is very impressed by the following great job.
|
| +
|
| +- Brendan Gregg's [FlameGraph](https://github.com/brendangregg/FlameGraph)
|
| + visualize hot-CPU code-paths.
|
| +
|
| +And using the following D3js example for visualization.
|
| +
|
| +- D3js example: [Sequences sunburst](http://bl.ocks.org/kerryrodden/7090426)
|
| +
|
| +
|
| +TODO
|
| +----
|
| +
|
| +- Show stack traces with colors
|
| +- Make sunburst trace graph zoomable
|
| +- Visualize with other d3js tools(Collapsible Tree, Zoomable Pack, and more)
|
| +- Visualize latency trace data collected with ftrace
|
|
|
 Chromium Code Reviews