 Chromium Code Reviews Chromium Code Reviews
| Index: docs/memory-infra/memory_benchmarks.md |
| diff --git a/docs/memory-infra/memory_benchmarks.md b/docs/memory-infra/memory_benchmarks.md |
| index a18158858e5108b13da539c212abcd126e4a0d32..6bf8953a1a297743cba435af138688837e31f4a6 100644 |
| --- a/docs/memory-infra/memory_benchmarks.md |
| +++ b/docs/memory-infra/memory_benchmarks.md |
| @@ -92,6 +92,12 @@ To view data from one of the benchmarks on the |
| * **Subtest (3):** The name of a *[user story](#User-stories)* |
| (with `:` replaced by `_`). |
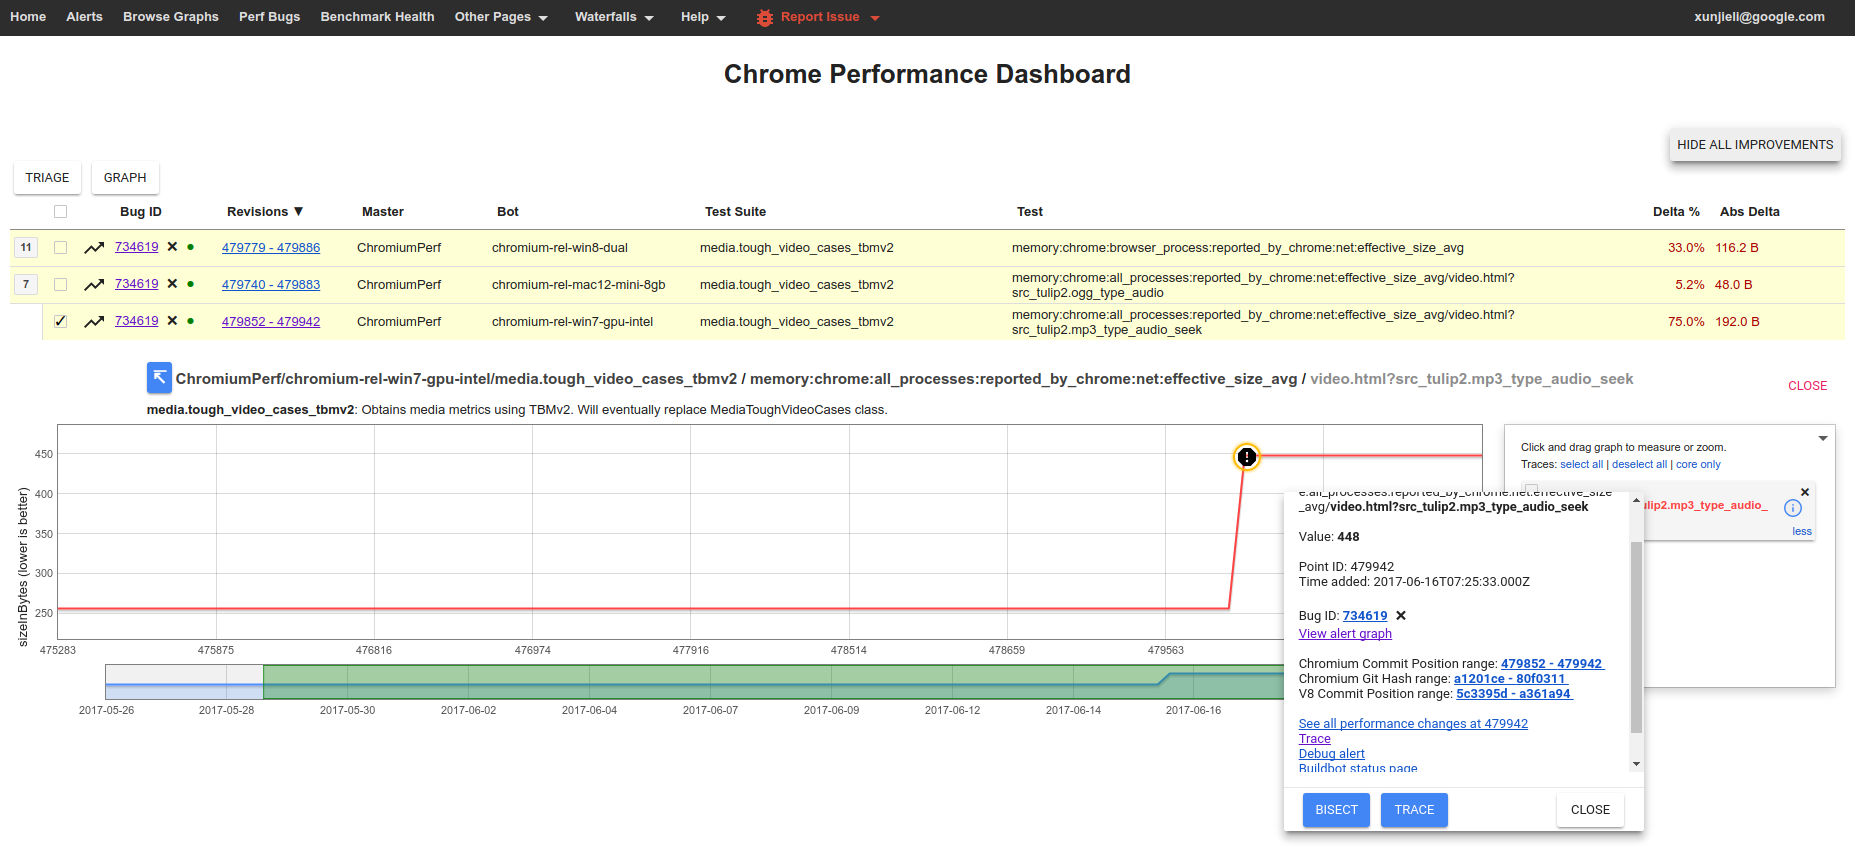
| +If you are investigating a Perf dashboard alert and would like to see the |
| +details, you can click on any point of the graph. It gives you the commit range, |
| +buildbot output and a link to the trace file taken during the buildbot run. |
| + |
| + |
|
xunjieli
2017/06/22 15:55:14
Primiano: should I rename the filename to contain
Primiano Tucci (use gerrit)
2017/06/23 08:53:41
Doesn't really matter. I think those hashes came f
xunjieli
2017/06/23 12:51:28
Acknowledged. Got it. Thank you.
|
| + |
| ## How to run the benchmarks |
| Benchmarks may be run on a local platform/device or remotely on a try job. |
| @@ -170,7 +176,13 @@ where: |
| * **source:** One of `reported_by_chrome` or `reported_by_os` |
| * **component:** May be a Chrome component, e.g. `skia` or `sqlite`; |
| details about a specific component, e.g. `v8:heap`; or a class of memory |
| - as seen by the OS, e.g. `system_memory:native_heap` or `gpu_memory`. |
| + as seen by the OS, e.g. `system_memory:native_heap` or `gpu_memory`. If |
| + reported by chrome, the metrics are gathered by `MemoryDumpProvider`s, |
| + probes placed in the specific components' codebase. For example, in |
| + "memory:chrome:all_processes:reported_by_chrome:net:effective_size_avg," |
| + the component is "net" which is Chrome's network stack and |
| + "reported_by_chrome" means that this metric is gathered via probes in |
| + the network stack. |
| * **kind:** The kind of memory being reported. For metrics reported by |
| Chrome this usually is `effective_size` (others are `locked_size` |
| and `allocated_objects_size`); for metrics by the OS this usually is |
