| OLD | NEW |
|---|
| 1 # Memory Benchmarks | 1 # Memory Benchmarks |
| 2 | 2 |
| 3 This document describes benchmarks available to track Chrome's and | 3 This document describes benchmarks available to track Chrome's and |
| 4 WebView's memory usage, where they live, what they measure, how to run them, | 4 WebView's memory usage, where they live, what they measure, how to run them, |
| 5 and on how to diagnose regressions. | 5 and on how to diagnose regressions. |
| 6 | 6 |
| 7 [TOC] | 7 [TOC] |
| 8 | 8 |
| 9 ## Glossary | 9 ## Glossary |
| 10 | 10 |
| (...skipping 77 matching lines...) Expand 10 before | Expand all | Expand 10 after Loading... |
| 88 see internal bots. | 88 see internal bots. |
| 89 * **Subtest (1):** The name of a *[metric](#Understanding-memory-metrics)*. | 89 * **Subtest (1):** The name of a *[metric](#Understanding-memory-metrics)*. |
| 90 * **Subtest (2):** The name of a *story group*; these have the form | 90 * **Subtest (2):** The name of a *story group*; these have the form |
| 91 `{interaction}_{category}` for system health stories. | 91 `{interaction}_{category}` for system health stories. |
| 92 * **Subtest (3):** The name of a *[user story](#User-stories)* | 92 * **Subtest (3):** The name of a *[user story](#User-stories)* |
| 93 (with `:` replaced by `_`). | 93 (with `:` replaced by `_`). |
| 94 | 94 |
| 95 If you are investigating a Perf dashboard alert and would like to see the | 95 If you are investigating a Perf dashboard alert and would like to see the |
| 96 details, you can click on any point of the graph. It gives you the commit range, | 96 details, you can click on any point of the graph. It gives you the commit range, |
| 97 buildbot output and a link to the trace file taken during the buildbot run. | 97 buildbot output and a link to the trace file taken during the buildbot run. |
| 98 (More information about reading trace files [here][memory-infra]) |
| 99 |
| 100 [memory-infra]: /docs/memory-infra/README.md |
| 98 | 101 |
| 99 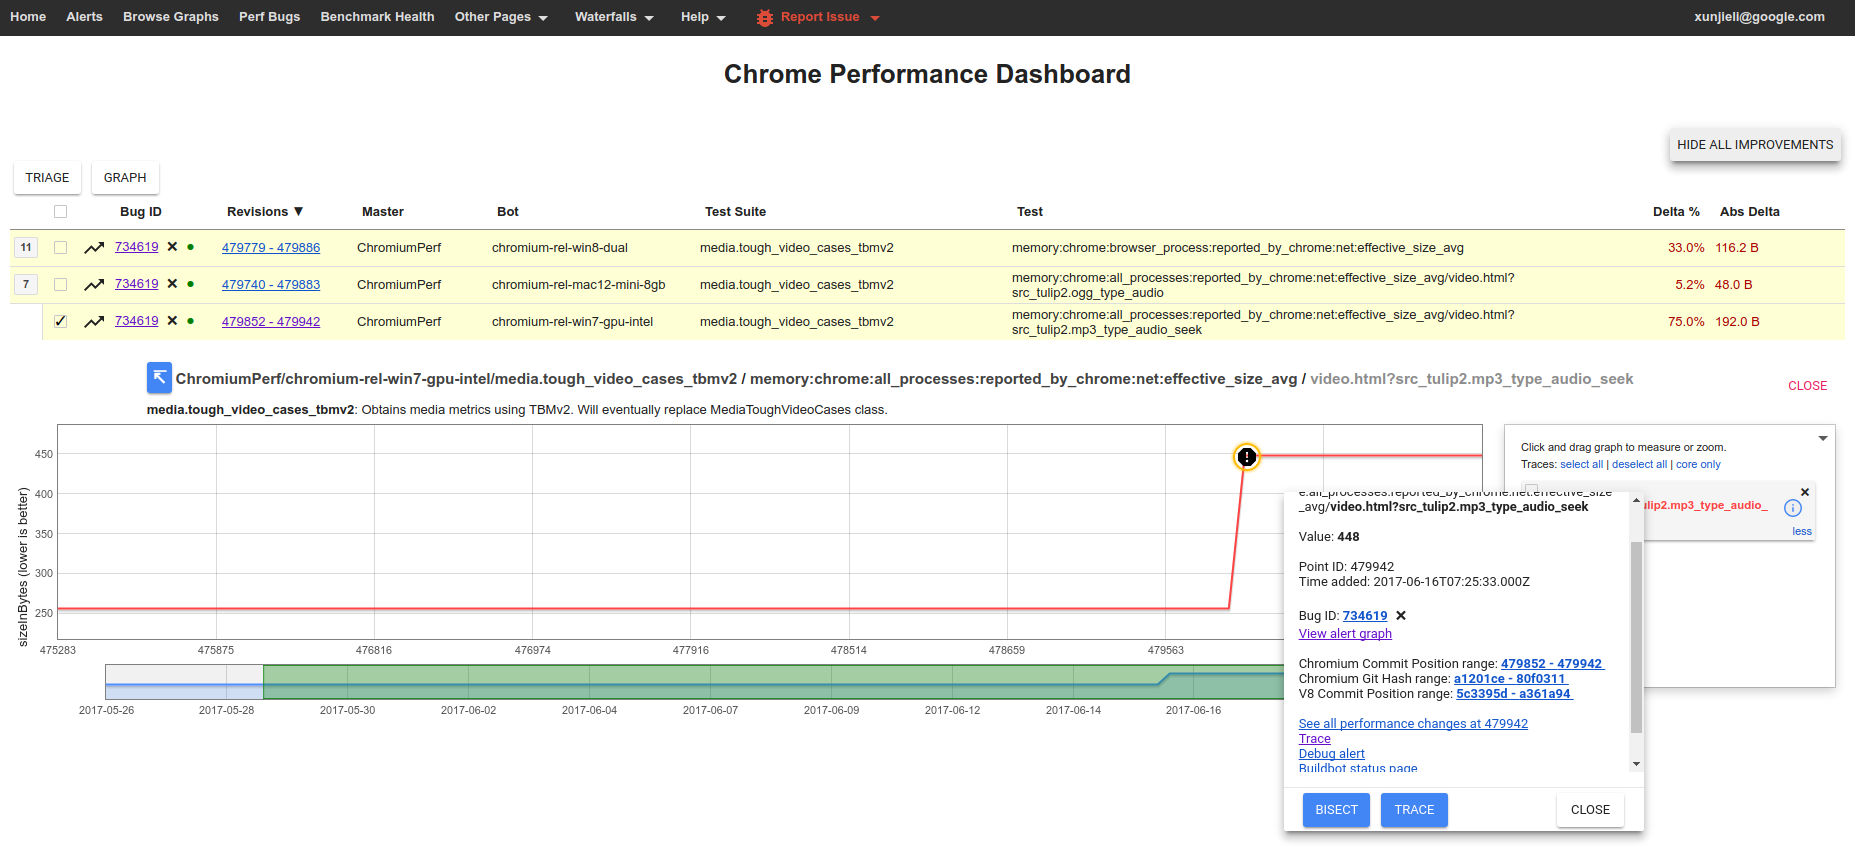 | 102  |
| 100 | 103 |
| 101 ## How to run the benchmarks | 104 ## How to run the benchmarks |
| 102 | 105 |
| 103 Benchmarks may be run on a local platform/device or remotely on a try job. | 106 Benchmarks may be run on a local platform/device or remotely on a try job. |
| 104 | 107 |
| 105 ### How to run locally | 108 ### How to run locally |
| 106 | 109 |
| 107 After building, e.g. `ChromePublic.apk`, you can run a specific system health | 110 After building, e.g. `ChromePublic.apk`, you can run a specific system health |
| (...skipping 17 matching lines...) Expand all Loading... |
| 125 to get individual [trace files][memory-infra] in addition to the | 128 to get individual [trace files][memory-infra] in addition to the |
| 126 `results.html` file. | 129 `results.html` file. |
| 127 * `--reset-results` - clear results from any previous benchmark runs in the | 130 * `--reset-results` - clear results from any previous benchmark runs in the |
| 128 `results.html` file. | 131 `results.html` file. |
| 129 * `--results-label [label]` - give meaningful names to your benchmark runs, | 132 * `--results-label [label]` - give meaningful names to your benchmark runs, |
| 130 this way it is easier to compare them. | 133 this way it is easier to compare them. |
| 131 | 134 |
| 132 For WebView make sure to [replace the system WebView][webview_install] | 135 For WebView make sure to [replace the system WebView][webview_install] |
| 133 on your device and use `--browser android-webview`. | 136 on your device and use `--browser android-webview`. |
| 134 | 137 |
| 138 [memory-infra]: /docs/memory-infra/README.md |
| 135 [webview_install]: https://www.chromium.org/developers/how-tos/build-instruction
s-android-webview | 139 [webview_install]: https://www.chromium.org/developers/how-tos/build-instruction
s-android-webview |
| 136 | 140 |
| 137 ### How to run a try job | 141 ### How to run a try job |
| 138 | 142 |
| 139 Given a patch on a chromium checkout, try jobs provide a convenient way to | 143 Given a patch on a chromium checkout, try jobs provide a convenient way to |
| 140 evaluate its memory implications on devices or platforms which | 144 evaluate its memory implications on devices or platforms which |
| 141 may not be immediately available to developers. | 145 may not be immediately available to developers. |
| 142 | 146 |
| 143 To start a try job [upload a CL][contributing] and run the command, e.g.: | 147 To start a try job [upload a CL][contributing] and run the command, e.g.: |
| 144 | 148 |
| (...skipping 37 matching lines...) Expand 10 before | Expand all | Expand 10 after Loading... |
| 182 "memory:chrome:all_processes:reported_by_chrome:net:effective_size_avg," | 186 "memory:chrome:all_processes:reported_by_chrome:net:effective_size_avg," |
| 183 the component is "net" which is Chrome's network stack and | 187 the component is "net" which is Chrome's network stack and |
| 184 "reported_by_chrome" means that this metric is gathered via probes in | 188 "reported_by_chrome" means that this metric is gathered via probes in |
| 185 the network stack. | 189 the network stack. |
| 186 * **kind:** The kind of memory being reported. For metrics reported by | 190 * **kind:** The kind of memory being reported. For metrics reported by |
| 187 Chrome this usually is `effective_size` (others are `locked_size` | 191 Chrome this usually is `effective_size` (others are `locked_size` |
| 188 and `allocated_objects_size`); for metrics by the OS this usually is | 192 and `allocated_objects_size`); for metrics by the OS this usually is |
| 189 `proportional_resident_size` (others are `peak_resident_size` and | 193 `proportional_resident_size` (others are `peak_resident_size` and |
| 190 `private_dirty_size`). | 194 `private_dirty_size`). |
| 191 | 195 |
| 192 [memory-infra]: /memory-infra/README.md | 196 [memory-infra]: /docs/memory-infra/README.md |
| 193 | 197 |
| 194 ## Appendix | 198 ## Appendix |
| 195 | 199 |
| 196 There are a few other benchmarks maintained by the memory-infra team. | 200 There are a few other benchmarks maintained by the memory-infra team. |
| 197 These also use the same set of metrics as system health, but have differences | 201 These also use the same set of metrics as system health, but have differences |
| 198 on the kind of stories that they run. | 202 on the kind of stories that they run. |
| 199 | 203 |
| 200 ### memory.top_10_mobile | 204 ### memory.top_10_mobile |
| 201 | 205 |
| 202 The [memory.top_10_mobile][memory_py] benchmark is in the process of being depre
cated | 206 The [memory.top_10_mobile][memory_py] benchmark is in the process of being depre
cated |
| (...skipping 38 matching lines...) Expand 10 before | Expand all | Expand 10 after Loading... |
| 241 | 245 |
| 242 Story groups are either `on_chrome` or `on_webview`, indicating the browser | 246 Story groups are either `on_chrome` or `on_webview`, indicating the browser |
| 243 in foreground at the moment when the memory measurement was made. | 247 in foreground at the moment when the memory measurement was made. |
| 244 | 248 |
| 245 * [memory.long_running_dual_browser_test][memory_extra_py] - same as above, | 249 * [memory.long_running_dual_browser_test][memory_extra_py] - same as above, |
| 246 but the test is run for 60 iterations keeping both browsers alive for the | 250 but the test is run for 60 iterations keeping both browsers alive for the |
| 247 whole duration of the test and without forcing garbage collection. Intended | 251 whole duration of the test and without forcing garbage collection. Intended |
| 248 as a last-resort net to catch memory leaks not apparent on shorter tests. | 252 as a last-resort net to catch memory leaks not apparent on shorter tests. |
| 249 | 253 |
| 250 [memory_extra_py]: https://cs.chromium.org/chromium/src/tools/perf/contrib/memor
y_extras/memory_extras.py | 254 [memory_extra_py]: https://cs.chromium.org/chromium/src/tools/perf/contrib/memor
y_extras/memory_extras.py |
| OLD | NEW |
|---|
 Chromium Code Reviews