| Index: docs/memory-infra/memory_benchmarks.md
|
| diff --git a/docs/memory-infra/memory_benchmarks.md b/docs/memory-infra/memory_benchmarks.md
|
| new file mode 100644
|
| index 0000000000000000000000000000000000000000..c33610afe10a920df632efb74c019efe8cbe4d87
|
| --- /dev/null
|
| +++ b/docs/memory-infra/memory_benchmarks.md
|
| @@ -0,0 +1,210 @@
|
| +# Memory Benchmarks
|
| +
|
| +This document describes benchmarks available to track Chrome's and
|
| +WebView's memory usage, where they live, what they measure, how to run them,
|
| +and on how to diagnose regressions.
|
| +
|
| +[TOC]
|
| +
|
| +## Glossary
|
| +
|
| +* **User story:** a set of actions to perform on a browser or device (e.g.
|
| + open google homepage, type "foo", click search, scroll down, visit first
|
| + result, etc.).
|
| +* **Metric:** a data aggregation process that takes a Chrome trace as input
|
| + (produced by a [Telemetry][] run) and produces a set of summary numbers as
|
| + output (e.g. total GPU memory used).
|
| +* **Benchmark:** a combination of (one or more) user stories and (one or
|
| + more) metrics.
|
| +
|
| +[Telemetry]: https://github.com/catapult-project/catapult/blob/master/telemetry/README.md
|
| +
|
| +## System Health
|
| +
|
| +*System health* is an effort to unify top-level benchmarks (as opposite to
|
| +micro-benchmarks and regression tests) that are suitable to capture
|
| +representative user stories.
|
| +
|
| +### Benchmarks
|
| +
|
| +System health memory benchmarks are:
|
| +
|
| +* [system_health.memory_mobile][system_health] -
|
| + user stories running on Android devices.
|
| +* [system_health.memory_desktop][system_health] -
|
| + user stories running on desktop platforms.
|
| +
|
| +These benchmarks are run continuously on the [chromium.perf][] waterfall,
|
| +collecting and reporting results on the
|
| +[Chrome Performance Dashboard][chromeperf].
|
| +
|
| +Other benchmarks maintained by the memory-infra team are discussed in the
|
| +[appendix](#Other-benchmarks).
|
| +
|
| +[system_health]: https://chromium.googlesource.com/chromium/src/+/master/tools/perf/page_sets/system_health/
|
| +[chromium.perf]: https://build.chromium.org/p/chromium.perf/waterfall
|
| +[chromeperf]: https://chromeperf.appspot.com/report
|
| +
|
| +### User stories
|
| +
|
| +System health user stories are classified by the kind of interactions they
|
| +perform with the browser:
|
| +
|
| +* `browse` stories navigate to a URL and interact with the page; e.g.
|
| + scroll, click on elements, navigate to subpages, navigate back.
|
| +* `load` stories just navigate to a URL and wait for the page to
|
| + load.
|
| +* `background` stories navigate to a URL, possibly interact with the
|
| + page, and then bring another app to the foreground (thus pushing the
|
| + browser to the background).
|
| +* `long_running` stories interact with a page for a longer period
|
| + of time (~5 mins).
|
| +* `blank` has a single story that just navigates to **about:blank**.
|
| +
|
| +The full name of a story has the form `{interaction}:{category}:{site}` where:
|
| +
|
| +* `interaction` is one the labels given above;
|
| +* `category` is used to group together sites with a similar purpose,
|
| + e.g. `news`, `social`, `tools`;
|
| +* `site` is a short name identifying the website in which the story mostly
|
| + takes place, e.g. `cnn`, `facebook`, `gmail`.
|
| +
|
| +For example `browse:news:cnn` and `background:social:facebook` are two system
|
| +health user stories.
|
| +
|
| +Today, for most stories a garbage collection is forced at the end of the
|
| +story and a memory dump is then triggered. Metrics report the values
|
| +obtained from this single measurement.
|
| +
|
| +## Continuous monitoring
|
| +
|
| +
|
| +
|
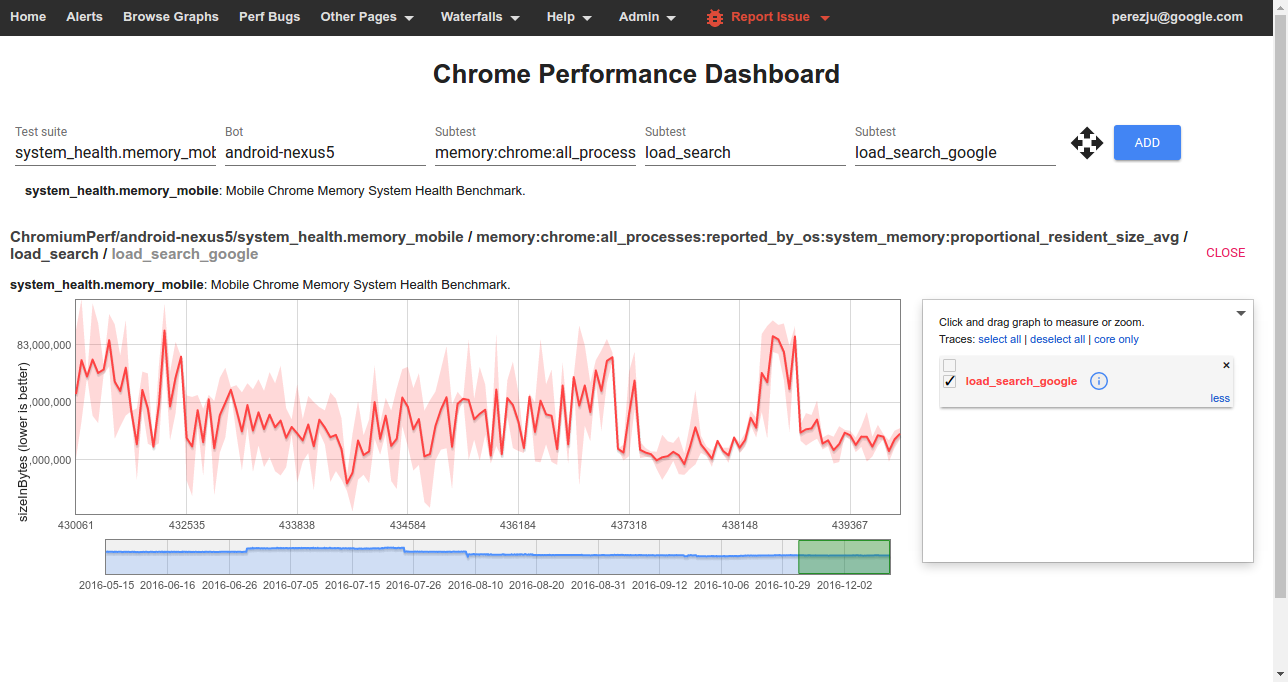
| +To view data from one of the benchmarks on the
|
| +[Chrome Performance Dashboard][chromeperf] you should select:
|
| +
|
| +* **Test suite:** The name of a *[benchmark](#Benchmarks)*.
|
| +* **Bot:** The name of a *platform or device configuration*. Sign in to also
|
| + see internal bots.
|
| +* **Subtest (1):** The name of a *[metric](#Understanding-memory-metrics)*.
|
| +* **Subtest (2):** The name of a *story group*; these have the form
|
| + `{interaction}_{category}` for system health stories.
|
| +* **Subtest (3):** The name of a *[user story](#User-stories)*
|
| + (with `:` replaced by `_`).
|
| +
|
| +## How to run the benchmarks
|
| +
|
| +Benchmarks may be run on a local platform/device or remotely on a try job.
|
| +
|
| +### How to run locally
|
| +
|
| +After building, e.g. `ChromePublic.apk`, you can run a specific system health
|
| +story with the command:
|
| +
|
| +```
|
| +$SRC/tools/perf/run_benchmark run system_health.memory_mobile \
|
| + --browser android-chromium --story-filter load:search:google
|
| +```
|
| +
|
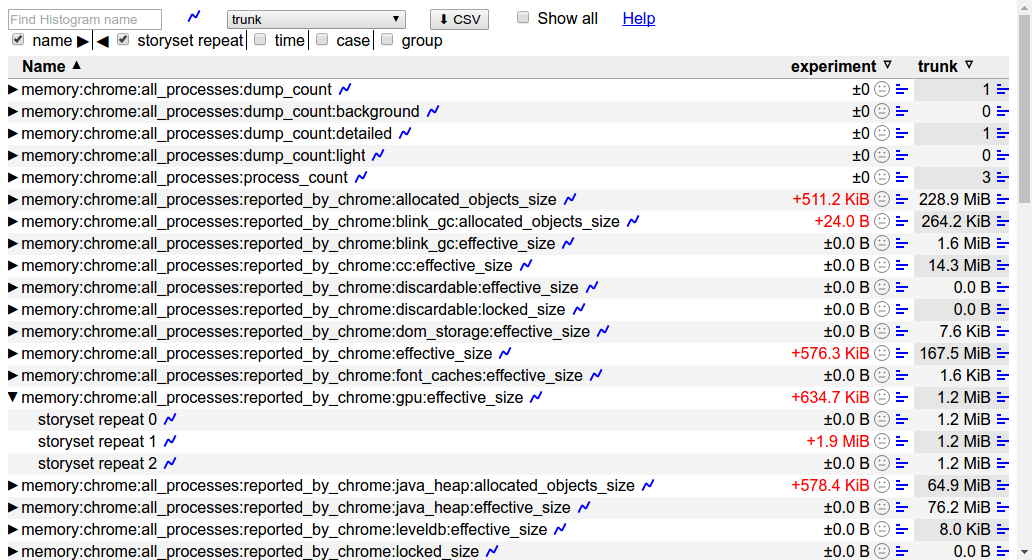
| +This will run the story with a default of 3 repetitions and produce a
|
| +`results.html` file comparing results from this and any previous benchmark
|
| +runs.
|
| +
|
| +
|
| +
|
| +Other useful options for this command are:
|
| +
|
| +* `--pageset-repeat [n]` - override the default number of repetitions
|
| +* `--output-format html --output-format json` - select *both* output formats
|
| + to get individual [trace files][memory-infra] in addition to the
|
| + `results.html` file.
|
| +* `--reset-results` - clear results from any previous benchmark runs in the
|
| + `results.html` file.
|
| +* `--results-label [label]` - give meaningful names to your benchmark runs,
|
| + this way it is easier to compare them.
|
| +
|
| +For WebView make sure to [replace the system WebView][webview_install]
|
| +on your device and use `--browser android-webview`.
|
| +
|
| +[webview_install]: https://www.chromium.org/developers/how-tos/build-instructions-android-webview
|
| +
|
| +### How to run a try job
|
| +
|
| +Given a patch on a chromium checkout, try jobs provide a convenient way to
|
| +evaluate its memory implications on devices or platforms which
|
| +may not be immediately available to developers.
|
| +
|
| +To start a try job [upload a CL][contributing] and run the command, e.g.:
|
| +
|
| +```
|
| +$SRC/tools/perf/run_benchmark try android-nexus5 system_health.memory_mobile
|
| +```
|
| +
|
| +This will run all of the system health stories for you, and conveniently
|
| +provide a `results.html` file comparing measurements with/without your patch.
|
| +Options like `--story-filter` and `--pageset-repeat` may also be passed to
|
| +this command.
|
| +
|
| +To see the full list of available try bots run the command:
|
| +
|
| +```
|
| +$SRC/tools/perf/run_benchmark try list
|
| +```
|
| +
|
| +[contributing]: https://www.chromium.org/developers/contributing-code
|
| +
|
| +## Understanding memory metrics
|
| +
|
| +There is a large number of [memory-infra][] metrics, breaking down usage
|
| +attributed to different components and processes.
|
| +
|
| +
|
| +
|
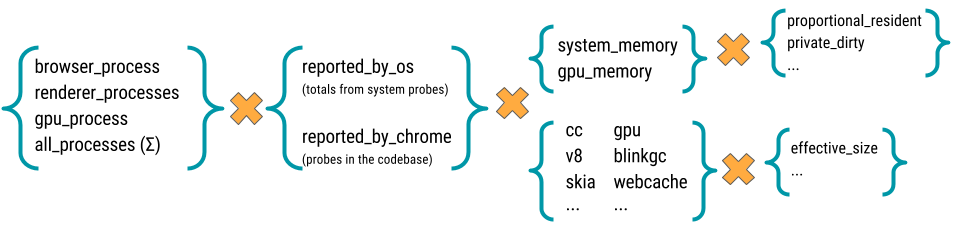
| +Most memory metrics have the form
|
| +`memory:{browser}:{processes}:{source}:{component}:{kind}`
|
| +where:
|
| +
|
| +* **browser:** One of `chrome` or `webview`.
|
| +* **processess:** One of `browser_process`, `renderer_processess`,
|
| + `gpu_process`, or `all_processess`.
|
| +* **source:** One of `reported_by_chrome` or `reported_by_os`
|
| +* **component:** May be a Chrome component, e.g. `skia` or `sqlite`;
|
| + details about a specific component, e.g. `v8:heap`; or a class of memory
|
| + as seen by the OS, e.g. `system_memory:native_heap` or `gpu_memory`.
|
| +* **kind:** The kind of memory being reported. For metrics reported by
|
| + Chrome this usually is `effective_size` (others are `locked_size`
|
| + and `allocated_objects_size`); for metrics by the OS this usually is
|
| + `proportional_resident_size` (others are `peak_resident_size` and
|
| + `private_dirty_size`).
|
| +
|
| +[memory-infra]: /memory-infra/README.md
|
| +
|
| +## Appendix
|
| +
|
| +### Other benchmarks
|
| +
|
| +Other benchmarks maintained by the memory-infra team are:
|
| +
|
| +* [memory.dual_browser_test][memory_py] - cycle between doing Google searches
|
| + on a WebView-based browser (a stand-in for the Google Search app) and
|
| + loading pages on Chrome. Runs on Android devices only.
|
| +
|
| + Story groups are either `on_chrome` or `on_webview`, indicating the browser
|
| + in foreground at the moment when the memory measurement was made.
|
| +
|
| +* [memory.long_running_dual_browser_test][memory_py] - same as above, but the
|
| + test is run for 60 iterations keeping both browsers alive for the whole
|
| + duration of the test and without forcing garbage collection. Intended as a
|
| + last-resort net to catch memory leaks not apparent on shorter tests.
|
| +
|
| +* [memory.top_10_mobile][memory_py] - cycle between loading a page on Chrome,
|
| + pushing the browser to the background, and then back to the foreground.
|
| + *(To be deprecated in favor of system_health.memory_mobile.)*
|
| +
|
| + Story groups are either `foreground` or `background` indicating the state
|
| + of the browser at the time of measurement.
|
| +
|
| +* [memory.top_10_mobile_stress][memory_py] - same as above, but keeps a single
|
| + instance of the browser open for 5 repetitions. *(To be deprecated.)*
|
| +
|
| +[memory_py]: https://chromium.googlesource.com/chromium/src/+/master/tools/perf/benchmarks/memory.py
|
|
|
 Chromium Code Reviews